Sentiment Report - Apple
This report will be analysing Apple’s stock for the week commencing 28th December 2020. This will be done using StockGeist, a platform that determines the sentiment towards a stock in real-time, by applying natural language processing to the latest news updates and social media posts. All times given are in GMT+0.
Overview
Apple Inc. (AAPL), after its founding in 1977, is now a market-leading consumer electronics manufacturer with its headquarters in Cupertino, California. The largest source of its revenue comes from its iPhone line, which consistently ranks first in the US market with an average market share of 45% (2019Q4 -2020Q3); 19% more than Samsung as the next biggest smartphone manufacturer. It also ranks fourth in worldwide market share for smartphones. As a Tech Giant, Apple is a component of the S&P 100, NASDAQ-100 and Dow Jones Industrial Average.
Analysis
Performance in 2020
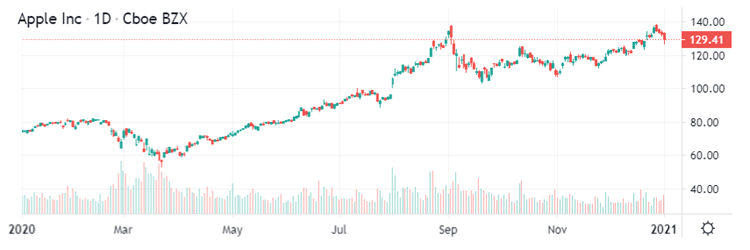
Following strong earnings and stock performance from the previous year, Apple’s stock had a strong start to 2020. A market sell-off resulted in a fall of 30.68% from 19th February to 23rd March as the markets reacted to the COVID-19 pandemic, global recession and Apple’s sales falling short of their forecasts – particularly in the Chinese market. The markets resurged on 24th March as investors anticipated a stimulus package, with the Dow Jones Industrial Average soaring by 2100 points – the largest daily increase to date. Further drivers of Apple’s stock increase can be broadly attributed to its projected sales and profit growth, such as from its services growth and 5G iPhone launch; as well as its 4-for-1 split which drove up the stock in August. Another drop occurred in September, following a broader market sell-off concentrated towards the tech-sector. Coming up to the end of the year, Apple’s stock recovered and set a new all-time high in the last week of trading (detailed in the following paragraph), resulting in a 75% increase since the start of the year.

Week commencing 28th December
Apple’s stock had a good start to the week commencing 28th December, rising by 2.58% during Monday’s trading hours to reach an all-time high. However, this momentum did not continue for the rest of the week as the stock fell on Tuesday, Wednesday and Thursday by 2.27%, 1.37% and 1.13% respectively. Ending the week with an overall decline of 0.60%, this was an underperformance compared to indices such as the S&P 500, which increased by 0.85% over the week, and featured gains in other tech companies such as Amazon, Alphabet and Tesla.
Recent news combined with StockGeist’s sentiment data can provide some insight into these movements. Looking at the start of the week, the recent news and optimism over Apple’s plans to expand its product line into the electric car industry was a key driver of the rally. This can be seen in the real-time sentiment tracker, as from 13:00-14:00pm before the US stock market opening, volume spiked 176% and 270% respectively for informative and emotional messages. The optimism was also reflected in the proportion of positive messages, with 53% positive in informative and 59% positive in emotional. The data also shows the flipside of this week, as optimism falls and Apple’s stock price declines from Tuesday onwards. For example, in the two hours before the market opened on Tuesday, the percentage of negative messages rose from 7% to 14% for informative messages and 7% to 28% for emotional messages. This trend continued for the rest of the week, following news on Tuesday that Apple lost a copyright fight against Corellium; and an announcement that Senate Majority Leader Mitch McConnell blocked an attempt to increase direct payments in the coronavirus relief package to $2000 from $600. This stifled optimism was also seen in the platform’s news feed, with more neutral and negative messages being identified.
Accuracy Test

Introduction
This analysis was performed to determine whether positive messages detected by StockGeist translated into an increase in stock price, and whether negative translated into a decrease in stock price; specifically for Apple stock trading in the week commencing 28th December. Please note that this analysis is not investment advice.
Methodology
Using the sentiment data from above, we can take different thresholds to determine whether each hour-long period has a ‘large’ amount of positive or negative messages, by comparing each to the largest of the two other categories. For example, looking at the first table for emotional messages, the threshold of 1.1x means that any period was considered positive if there were 10% more positive messages compared to neutral or negative messages. A percentage is then calculated based on how often the price increased across these positive periods, which would be 42% of the time if the threshold is taken as 1.1x. Here, a price increase occurs in the same hourly period and is defined as the closing stock price being greater than the opening price. The average change in price is also calculated from all of the identified positive periods. A likewise process was used for negative messages, but as the volume never exceeded neutral or positive messages, thresholds below 1x were taken.
Results
We can see that both positive and negative emotional messages were very useful indicators for the direction of stock movement, with increasing thresholds giving greater magnitudes of price change and accuracy. For example, a threshold of 1.5x (50%) more emotional positive messages gave an average price increase of 0.85% ($1.15) with 100% accuracy for this week of trading. This reflects the increasing evidence of social media’s relationship with the stock market. With a larger set of data to view historical patterns between the stock price and sentiment data, this sentiment data would be a useful tool to determine the likelihood that a stock will move in a particular direction. Similarly, negative informative messages appear to be a good indicator for users to determine decreases in stock price, again with 100% accuracy observed for the 0.5x threshold; although, the informative positive messages were not very accurate in determining increases in Apple’s stock price for this week, as the average price changes were negative across all thresholds.
Reflections
This relationship was the most obvious route of analysis to determine how well positive and negative sentiment data might represent changes in stock price. However, this was not the most rigorous approach and accuracy benchmarks can be improved by observing combinations of metrics and a using wider range of metrics for Apple’s stock. This includes the use of neutral messages, deviations in each type of message, raw percentages of each type of message, by-the-minute data, magnitude of price change, and aggregate sentiment data from other stocks. Observations over longer periods of time will also provide traders with greater certainty in the direction of the stock price.
Conclusion
Given the heightened level of uncertainty in today’s markets, opinions are scatted about which direction Apple’s stock price take going forward into the new year. Concerns include potential over-valuation, poor returns on invested capital, as well as revenue losses as competitors such as Xiaomi outstrip Apple’s growth rate, and apps such as Fortnite put pressure on the Apple’s commission. This conflicts with opinions that Apple will maintain its momentum as global economic growth is projected to bounce back in 2021, continuing its strong sales of the iPhone 12 and its expansion of its other product lines. While this is all uncertain, this analysis has indicated StockGeist as a useful tool in understanding the market sentiment in real-time, along with which direction the stock is likely to take.