Investment Terminology: Some Key Concepts
Understanding the performance of different assets can be difficult due to the many technical measures that have been created. However, by understanding a couple of key concepts, anyone can begin to review the performance of investments. In this article, we look at some of the basic measures which can be instantly applied to review assets in the real world.
The notion of risk-reward is often used as a starting point when discussing investing, but how is this translated in the investment management industry?
Let us begin firstly by understanding reward.
Reward means the profit made from investing. However, nominal values are rarely used to represent profits, especially when evaluating investments in the financial markets. Instead, returns are often used.
Returns
Returns measure profits as a percentage of the initial investment. In investment management, this refers to how much an asset has grown proportional to the initial investment. It allows analysts to measure performance without being biased by an investment’s size. Returns provide a universal measure of performance between funds or investments. Naturally, a fund of hundreds of millions will find a target profit of one million much more attainable than a fund worth only a couple of million.
This is especially relevant in the financial markets. Investors are not constrained by the number of investments they own, but by the cost of their investments. In highly liquid markets where investment opportunities are not scarce, smaller investments can easily be scaled up by purchasing additional stock or other assets – nominal profits become obsolete.
An example to illustrate this is the performance of Amazon compared to GameStop between the 5th-20th January 2021. One Amazon share returned a profit of $44.87 (not bad for 15 days) compared to one GameStop share only paying the investor back an extra $21.75. But the returns of each asset paint a different picture. Amazon grew by 1.39% compared to the 125.22% of GameStop. If the $3218.51 needed for Amazon were used to buy the equivalent shares of GameStop, an investor could’ve made much more profit. Of course, this is an extreme example, but the principle still applies.
So rewards can be represented by returns, but what about risk?
Standard Deviation
One common measure in statistics is the standard deviation. Technically this is the average dispersion of a dataset compared to its mean value 1. In investment management, this dataset is the return of an investment compared to its expected (or mean) return. Standard deviation is a measure of volatility – two assets with the same expected return can have very different standard deviations resulting in widely different returns at any given time. Assets with higher standard deviation are more volatile and in the eyes of investors, and volatility is a risk. With greater volatility, an investor is more exposed to more uncertainty about the actual value of their investment at the point they want to sell.
For example, Proctor and Gamble, a potentially stable and low volatility stock over recent years has a standard deviation of 1.12 [2, compared to the much more volatile Tesla with a standard deviation of 3.87 3.
As humans, we do not like risk. When presented with the choice between equally profitable assets, we prefer the one with the least risk. As investors we require compensation for holding riskier assets, otherwise, no one would invest in them.
Helpfully, there is a measure that gives investors an idea of the returns they should expect for taking on certain amounts of risk.
Beta
This is the first finance-specific term we will look at is called beta which refers to a certain amount of risk an asset carries. Importantly the riskiness or volatility of a stock can be separated into two categories: systematic risk and idiosyncratic/ unsystematic risk.
Beginning first with idiosyncratic risk, this is a risk unique to individual firms. Owning shares of a car manufacturer is subject to the risk that the company undergoes bad press due to some faults with the cars which causes its shares to drop in price. This risk does not affect the car industry as a whole or even the wider market – only that firm. Unsystematic risk is labelled as such because it can be diversified away by investing in different stocks or even different asset classes (see another Finance Focussed article for an explanation of this 4). Most models imply that investors cannot expect to be compensated for this risk.
The systematic risk however cannot be eliminated through diversification. Therefore this carries some reward (otherwise investors would simply invest in bonds which are far more secure). Systematic risk can be represented by beta. Specifically, beta measures the volatility of a stock compared to the overall market. More precisely:
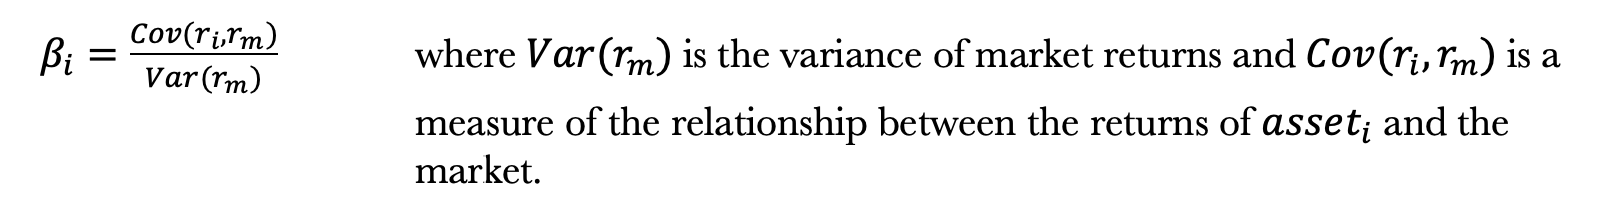
To understand beta, the specific details of calculating the covariance (Cov) are not important, just that it represents a relationship between the two if it is non-zero.
The larger an asset's beta, the more ‘systematically’ risky it is. These betas can also be interpreted as corresponding to assets with prices that move more than the market does on average. This includes both positively and negatively – hence the risk factor. Assets with large betas should generate higher returns on average to compensate investors for the additional (non-diversifiable) volatility over and above that of the overall market.
Returning to the same examples as volatility, Proctor & Gamble has a beta of 0.38 5 and Tesla has a beta of 2.19 6. As the market moves, Tesla’s share price (on average) moves much more, and the price of Proctor & Gamble shares moves much less. Naturally then, Tesla has provided much higher returns.
Importantly higher betas are not always good. Yes, they imply higher average returns. But they also imply more risk. Whether someone desires a portfolio of higher betas or not depends on their appetite for more or less risk.
There is also another Greek letter used in measuring returns that is useful in analysing a different type of return.
Alpha
The concept of risk and our natures as humans mean that higher returns usually come at the cost of exposure to additional risk and as a result, may not be ideal for everyone.
Alpha is another common, finance-specific measure. It is similar to beta as it provides information on the performance of an asset or a fund manager. Alpha is sometimes referred to as abnormal returns – returns above and beyond what is deemed fair by risk models.
For example, Proctor and Gamble’s beta implies relatively low returns stemming from its usual lower movements in price. If it were to outperform Tesla (with a higher beta and risk) this is an example of alpha. It can be described as returns above (or below in the case of negative alpha) the returns of a fair benchmark. Fund managers may be benchmarked against a certain index, and any returns they make above that index are alpha or their ability to ‘beat the market’.
A key distinction between the interpretation of alpha and beta is that higher betas are not always desirable, alpha, on the other hand, is. It signals reward above what can be expected, without the additional risk. Fund managers that generate positive alphas provide their investors with superior returns than should be expected, either by beating the market or by providing returns which higher than what is fair given the assets’ risks. The best managers are those who can consistently provide alpha to their investors (whether this can be achieved is a different discussion).
Take Away Points
We have covered four measures used to review and evaluate the performances of assets from multiple perspectives:
Returns – the profitability of assets irrespective of size. Smaller, high return investments can easily be scaled up in liquid markets so nominal profits on individual investments are less important.
Standard deviation – a measure of an asset’s volatility. A higher standard deviation means a wider distribution of prices and more risk.
Beta – a measure of the systematic risk of a stock. Stocks with higher betas, on average, provide higher returns as compensation for the extra risk.
Alpha – a risk-adjusted measure of returns. Positive alphas imply superior returns compared to a benchmark or risk model. Everyone desires positive alphas.